BarChart
A bar chart.
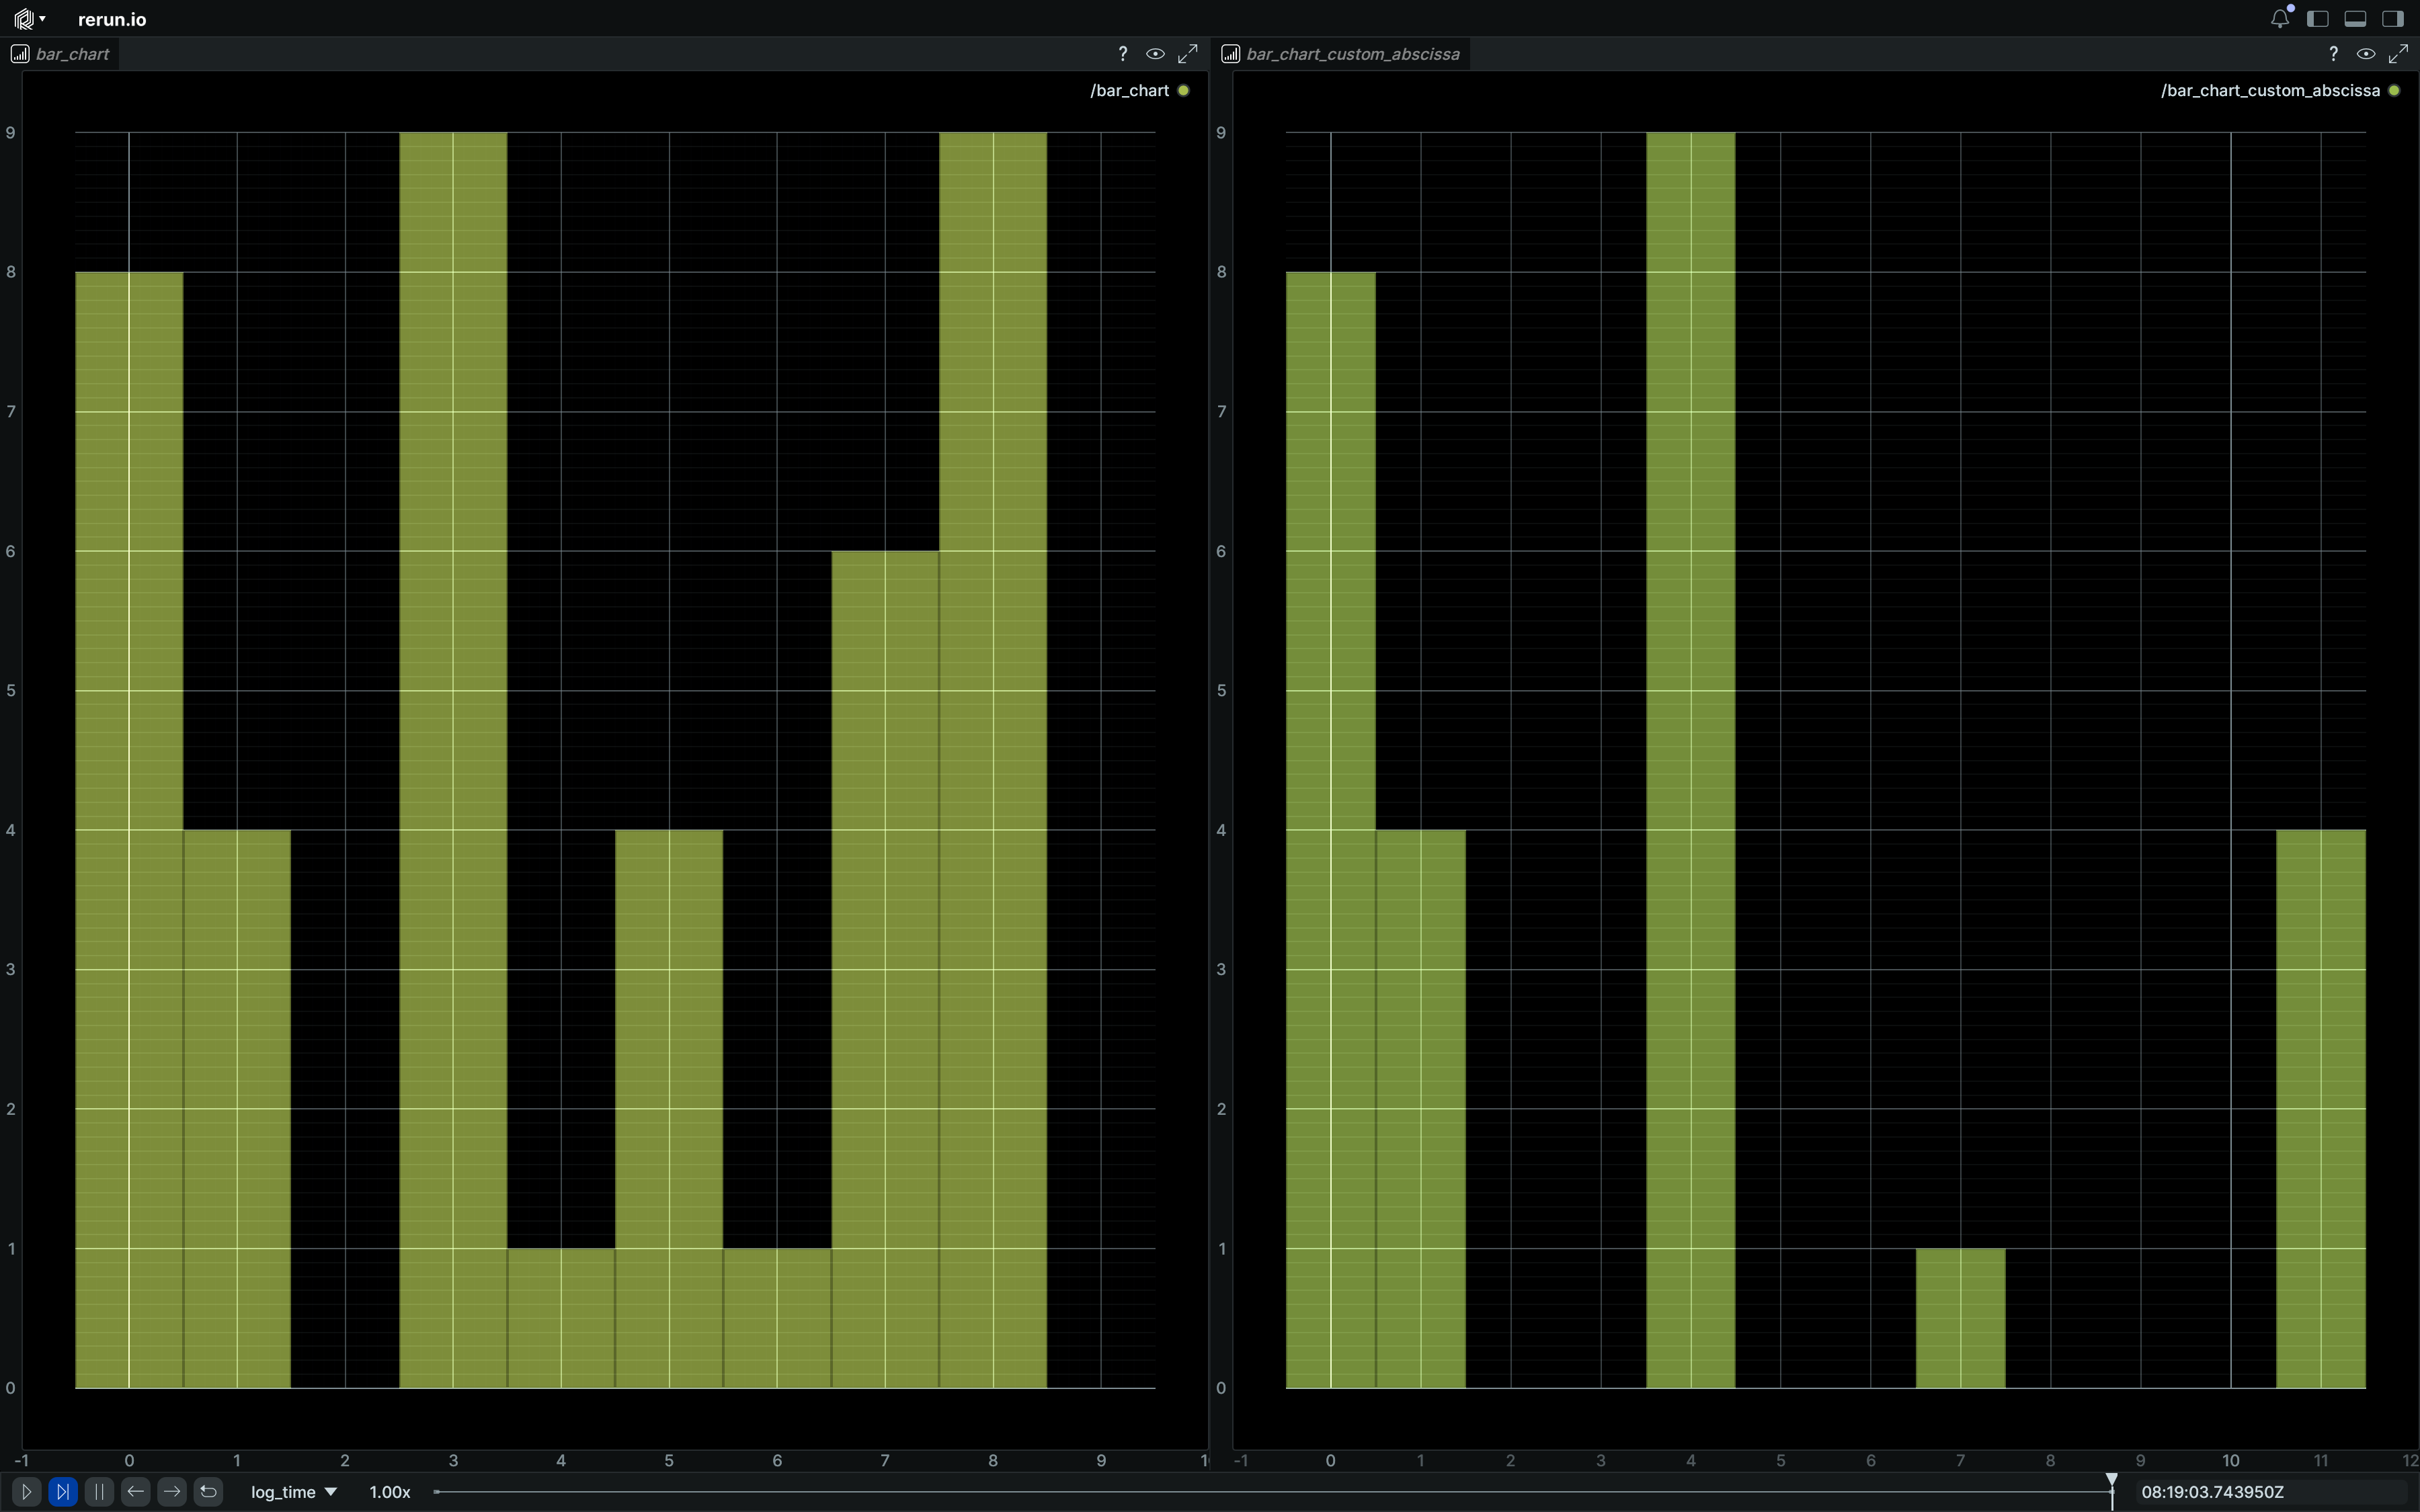
The bar heights will be the provided values, and the x coordinates of the bars will be the provided abscissa or default to the index of the provided values.
Fields fields
Required required
values:TensorData
Optional optional
color:Colorabscissa:TensorData
Can be shown in can-be-shown-in
API reference links api-reference-links
Example example
Simple bar chart simple-bar-chart
"""Create and log a bar chart."""

import rerun as rr

rr.init("rerun_example_bar_chart", spawn=True)
rr.log("bar_chart", rr.BarChart([8, 4, 0, 9, 1, 4, 1, 6, 9, 0]))
rr.log("bar_chart_custom_abscissa", rr.BarChart([8, 4, 0, 9, 1, 4], abscissa=[0, 1, 3, 4, 7, 11]))